Tuesday, April 26, 2011
Friday, April 15, 2011
THE KOPPEN CLIMATE CLASSIFICATION SYSTEM
THE KOPPEN CLIMATE CLASSIFICATION SYSTEM
Introduction

The concepts of devising climate classes that combine temperature and precipitation characteristics, but of setting limits and boundaries fitted into known vegetation and soil distributions were actually carried out in 1918 by Dr. Wladimir Koppen of the University of Graz, in Austria. Koppen was both a climatologist and a plant geographer, so his main interest lay in finding climate boundaries that coincided approximately with boundaries between major vegetation types. Although he was not entirely successful in achieving his goal, his climate system has appealed to geographers because it is strictly empirical and allows no room subjective decisions.
The classification was subsequently revised and extended by his students to become the most widely used of climatic classifications for geographical purposes.
BASIS FOR THE CLASSIFICATION
The Koppen system is strictly empirical. This is to say that each climate is defined according to fixed values of temperature and precipitation, computed according to the averages of the year or of individual months. In such a classification, no concern whatsoever is given to the causes of the climate in terms of pressure and wind belts, air masses, fronts, or storms. It is possible to assign a given place to a particular climate sub-group solely on the basis of the records of the temperature and precipitation of that place, provided, of course, that the period of record is long enough to yield meaningful averages. Air temperature and precipitation are the most easily obtainable surface weather data, requiring only simple equipment and a very elementary observer education. A climate system based on these data has a great advantage, in that the area covered by each sub-type of climate can be delineated (outlined, profiled) for large regions of the world.
LIMITATIONS
As with any regional classification, this system is not universally applicable. It utilizes, for example, only the data or mean monthly temperature and precipitation. There is not provision for variations in the strength or constancy of winds, temperature extremes, precipitation intensity and range, amount of cloud cover, or the net radiation balance. Its greatest inadequacies perhaps lie in its application to humid dry boundaries, and it should not be considered for land management and planning purposes, where more precise and varied factors should be utilized.
ADVANTAGES
Despite these and other disadvantages, this system has been used mainly because of four reasons that have special value.
1. It has precise definitions that can be applied easily to standardize data that are available for locations throughout the world.
2. There is a reasonable correlation globally with major vegetation regions.
3. It requires a minimum amount of calculation.
4. It is widely used in educational circles throughout the world.
DESIGNATION OF VARIOUS TYPES
The Koppen features a short hand code of letters designating major climate groups, sub-groups within the major groups and further sub-divisions to distinguish particular seasonal characteristics of temperature and precipitation.
Major Groups  Five major climate groups are designated by capital letters as follows: A–Tropical Rainy Climate: Average temperature of every month is above 64.4oF (18oC). These climates have no winter season. Annual rainfall is large and exceeds annual evaporation. B–Dry Climate: Potential evaporation exceeds precipitation on the average throughout the year. No water surplus; hence no permanent streams originate in B Climate Zones. C–Mild, Humid (Mesothermal) Climates: Coldest month has an average temperature under 64.4oF (18oC), but above 26.6oF (-3oC); at least one month has an average temperature above 50oF (10oC). The sea climates have both a summer and a winter season. D– Snowy Forests (Microthermal) Climates: Coldest month has an average temperature under 26.6oF. Average temperature of warmest month is above 50oF. E–Polar Climates: The average temperature of warmest month is blow 50oF. The climates have no true summer.      Four of these five groups (A, C, D and E) are defined by the temperature averages, whereas one (B) is defined by the precipitation to evaporation ratios. This procedure may seem to be of fundamental inconsistency. Groups A, C and D have sufficient heat and precipitation for both of high trunk trees, e.g., forest and woodland vegetation. |

Sub-Groups
Sub-groups within the five major groups are designate by a second letter, according to the following codes:-
S – Steppe Climate: A semi-arid climate with about 15-30 inches (38-76 cm) of rainfall annually at low latitudes.
W – Desert Climate: Arid climate. Most regions included have less than 10 inches (25 cm) of rainfall annually.
The letters S and W are applied only to the dry B climates, yielding two combinations – BS and BW.
f:- Moist. Adequate precipitation in all months. No dry season. This modifier is applied to A, C and D groups, yielding combinations – Af, Cf and Df.
w:- Dry season in the winter of the respective hemisphere (low sun season). This modifier is applied to A, C and D groups, yielding combinations – Aw, Cw and Dw.
s:- Dry season in the summer of the respective hemisphere (high sun season).
m:- Rainforest climate. Despite short, dry season in monsoon type of precipitation cycle. Applies to only A climates (Am).
Types of Climates
From the combination of the two letter groups, twelve distinct climates emerge as follows:
Tropical Rainforest Climate (Af): Rainfall of the driest month is 6 cm or more.
Monsoon variety of Af (Am): Rainfall of the direst month is less than 6 cm. The dry season is strongly developed.
Tropical Savanna Climate (Aw): At least one month has rainfall less than 6 cm. The dry season is strongly developed.
Steppe Climate (BS): A semi-arid climate characterized by grasslands. It occupies an intermediate position between the desert climate “BW” and the more humid climates of A, C and D groups.
Desert Climate (BW): An arid climate with annual precipitation usually less than 40 cm.
Mild Humid Climate with no dry season (Cf): Temperate rainy climate, moist in all seasons. Precipitation of the driest month averages more than 3 cm.
Mild Humid Climate with a dry winter (Cw): Temperate rainy climate with dry winter. The wettest month of summer has at least 10 times the precipitation of the driest month of winter or 70% or more of the mean annual precipitation falls in the warmer six months.
Mild Humid Climate with a dry summer (Cs): Temperate rainy climate with dry summer. Precipitation of the driest month of summer is less than 3 cm. Precipitation of the wettest month of winter is at least 3 times as much as that of the driest month of summer or 70% or more of the mean annual precipitation falls in the six months of winter.
Snowy Forest Climate with a moist winter (Df): Cold snowy forest climate with moist in all seasons.
Snowy Forest Climate with a dry winter (Dw): Cold snowy forest climate with dry winter.
Tundra Climate (ET): Mean temperature of the warmest month is above 0oC, but below 10oC.
Perpetual Frost Climate (EF):Ice-sheet climate. Mean monthly temperatures of all months are below 0oC.
Further Variations
To differentiate more variations in temperature or weather elements, Koppen added a third letter to the code group. Meanings are as follows:
a: With hot summer; warmest month over 71.6oF. Used for C and D climates.
b: With warm summer; warmest month below 71.6oF. Used for C and D climates.
c: With cold, short summer; less than 4 months over 50oF. Used for C and D climates.
d: With very cold winter; coldest month below –36.4oF. Used for D climates only.
h: Dry, hot; mean annual temperature over 64.4oF. Used for B climates only.
k: Dry, cold; mean annual temperature under 64.4oF. Used for B climates only.
Analyzed according to the Köppen system, India hosts six major climatic subtypes, ranging from desert in the west, to alpine tundra and glaciers in the north, to humid tropical regions supporting rain forests in the southwest and the island territories. Many regions have starkly different micro climates. The nation has four seasons: winter (January and February), summer (March to May), a monsoon (rainy) season (June to September), and a post-monsoon period (October to December).
Thursday, April 14, 2011
Jet Stream
 What is the Jet Stream?
The jet stream is a river of wind that blows horizontally through the upper layers of the troposphere, generally from west to east, at an altitude of 20,000 - 50,000 feet (6,100 - 9,144 meters), or about 7 miles (11 kilometers) up. A jet stream develops where air masses of differing temperatures meet. For this reason, surface temperatures determine where the jet stream will form. The greater the difference in temperature, the faster the wind velocity inside the jet stream. Jet streams can flow up to 200 mph (322 km/h), are 1000's of miles long, 100's of miles wide, and a few miles thick.
Where the jet stream begins
o Air warmed in the tropics around the equator fuels the jet stream as it rises. Hitting the tropopause at about 58,000 feet (the layer of the atmosphere separating the troposphere from the stratosphere), it is drawn toward the colder air at the north and south poles.
Jet Stream Atmospheric Positions  Positions of jet streams in the atmosphere. Arrows indicate directions of mean motions in a meridional plane. |
How it forms a convection cell
 o At higher latitudes, the warm air cools and sinks, drawing more warm air in behind it. The cooled air flows back towards the equator, creating a loop or convection cell.
Why the jet stream flows on an easterly course
 o
o As the earth rotates on its axis, so does the air around it. Due to this easterly rotation, rising warm air builds up momentum going the same direction. Thus, the jet stream cannot flow due north or due south, but makes an angular approach from the west, toward both poles.
Why the jet stream is so fast
 o Objects and air at the equator rotate around the earth's axis much faster than they do at more northerly or southerly latitudes. Thus, as the warmer air is drawn toward the poles, it moves faster, relative to the earth's surface. Because the rising warm air feeding the jet stream happens all along the equator, the effects accumulate, giving rise to high-speed winds.
The size of the jet stream
o The jet stream is no more than three miles thick, a few hundred miles wide and circles the earth. The size changes as temperature and other air masses meet the jet stream, causing it to shift its course.
Identification
o Jet streams move around the Earth in a narrow band. They are created by the difference in temperatures between two air masses, usually cold polar air and warm tropical air. The temperature variance creates gradients in air pressure, which in turn affects the strength of the winds in the jet stream. The greater the variance, the greater the wind speed. Jet stream winds normally are 100 to 200 mph but can reach speeds as high as 300 mph.
Development
o A jet stream develops where air masses of differing temperatures meet, so surface temperatures help determine where they will form. The jet stream is snakelike, undulating like a river, because of the pressures on either side from the warm and cold air masses.
When the jet stream is pushed south by a cold air mass, it allows high pressure to sink and create colder-than-normal weather in the South. In the opposite situation, when northern regions get warmer than normal, the jet stream has been pushed north by tropical air.
Jet streams travel from west to east in both hemispheres.
History
o Jet streams were discovered in the 1920s by meteorologist Wasburo Ooishi, who was using weather balloons for his study of high elevation wind patterns over Japan. In 1939, German meteorologist H. Seilkopf was the first to use the term "jet stream" in a published scientific paper.
However, it wasn't until World War II, when the Japanese used the jet stream for fire balloon attacks on the American mainland, that the upper-level winds gained public recognition. Wiley Post, an American aviation pioneer, is credited with being the first person to fly within a jet stream. He and other WWII military pilots flying Boeing B-29 Superfortress bombers found the jet stream made high altitude flights difficult.
Weather Effects
o Currents travel at varying wind speeds within a jet stream, with the greatest speeds at the core. A jet stream contains jet streaks, where the wind velocity is higher than the rest of the stream. The jet streaks cause air to rise, lowering the air pressure at the Earth's surface. When surface pressures are low, the rising air can form clouds, precipitation and storms.
Air Travel
o Jet streams play a major role in air travel. Eastbound flights usually take less flying time than westbound flights because of help from the fast-moving air. Jet streams can contain wind shear, a violent and sudden change in wind direction and speed, which is a major threat in air travel. Wind shear has caused airliners to suddenly lose altitude, putting them in danger of crashing. In 1988, the FAA decided that all commercial aircraft must have wind-shear warning systems, but it wasn't until 1996 that all airlines had them on-board.
Types of Jet Streams !!! 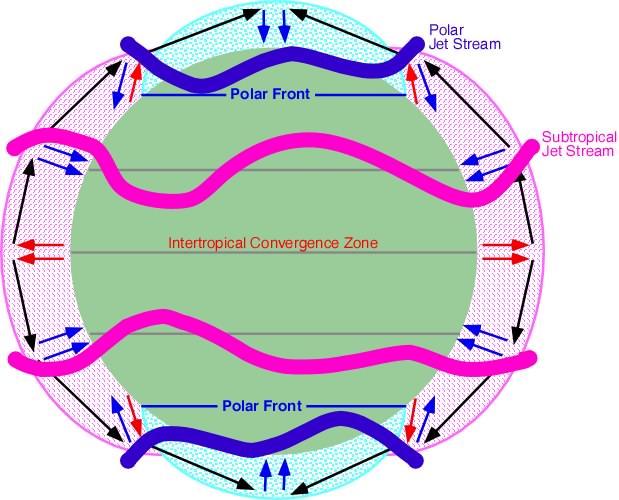 SUBTROPICAL JET STREAMS.— These jets, like the polar-front jets, are best developed in winter and early spring. During summer, in the Northern Hemisphere, the subtropical jet weakens considerably, and it is only identifiable in sporadic velocity streaks around the globe. During winter, subtropical jets intensify and can be found between 20° and 50° latitude. Their maximum speed approaches 300 knots, although these higher wind speeds are associated with their merger with polar-front jets. The core is most frequently found between 35,000 and 40,000 feet. A subsidence motion accompanies subtropical jets and gives rise to predominantly fair weather in areas they pass over. These jets are also remarkably persistent from time to time, but they do fluctuate daily. Sometimes they drift northward and merge with a polar-front jet. Over Asia in summer, the subtropical jet is replaced by the tropical easterly jet stream. TROPICAL EASTERLY JET STREAM.— This jet occurs near the tropopause over Southeast Asia, India, and Africa during summer. The strongest winds are over southern India, but they are not as intense as the winds encountered in polar-front or subtropical jet streams. This jet is closely connected to the Indian and African sum-mer monsoons. The existence of this jet implies that there is a deep layer of warm air to the north of the jet and colder air to the south over the In-dian Ocean. This warm air is of course associ-ated with the maximum heating taking place over India in summer, while the colder air is over the ocean. The difference in heating and cooling and the ensuing pressure gradient is what drives this jet. POLAR-NIGHT JET STREAM.— This jet meanders through the upper stratosphere over the poles. It occurs only during the long winter night. Remember, night is 6 months long over the pole in which winter is occurring. The polarstratosphere undergoes appreciable cooling due to the lack of solar radiation. The horizontal temperature gradient is strongly established bet-ween the equator and the pole, and the pressure gradient creates this westerly jet. The temperature gradient breaks down intermittently during middle and late winter in the Northern Hemisphere; therefore, the jet is intermittent at these times. In the Southern Hemisphere the temperature gradient and jet disappear rather abruptly near the time of the spring equinox. |
Detailed explanation on how the Jet Streams affect the Monsoons and the Indian Sub Continent ?
Jet Streams are fast flowing winds blowing in a narrow zone in the high altitude above 12000 m in troposphere. There are a number of separate jet streams whose speed varies from 110 km/h in summer to about 184 km/h in winter.In winter the sub-tropical westerly jet streams bring rain to the western part of India, especially Himachal Pradesh, Haryana and Punjab. In summer the sub-tropical easterly jet blows over Peninsular India approximately at 14ON and bring some rain and storm.
| There are different jet streams and in respect of the climate and monsoons of India it is the Subtropical Jet Stream (STJ) and the countering easterly jet that are most important. As the summertime approaches there is increased solar heating of the Indian subcontinent, this has a tendency to form a cyclonic monsoon cell situated between the Indian Ocean and southern Asia. This cell is blocked by the STJ which tends to blow to the south of the Himalayas, as long as the STJ is in this position the development of summer monsoons is inhibited. During the summer months the STJ deflects northwards and crosses over the Himalayan Range. The altitude of the mountains initially disrupts the jet but once it has cleared the summits it is able to reform over central Asia. With the STJ out of the way the subcontinental monsoon cell develops very quickly indeed, often in a matter of a few days. Warmth and moisture are fed into the cell by a lower level tropical jet stream which brings with it air masses laden with moisture from the Indian Ocean. As these air masses are forced upward by north India’s mountainous terrain the air is cooled and compressed, it easily reaches it’s saturation vapour point and the excess moisture is dissipated out in the form of monsoon rains. The end of the monsoon season is brought about when the atmosphere over the Tibetan Plateau begins to cool, this enables the STJ to transition back across the Himalayas. This leads to the formation of a cyclonic winter monsoon cell typified by sinking air masses over India and relatively moisture free winds that blow seaward. This gives rise to relatively settled and dry weather over India during the winter months. This year has been something of an exception. Atmospheric changes over the southern Pacific Ocean led to warmer than usual waters flowing into the Indian Ocean. This provided additional moisture to feed the monsoon systems. Further to the north the polar jet stream stalled due to being countered by Rossby Waves, there was a large kink in the stream and this was centred over Russia. The stalled system prevented weather systems being drawn across Russia and the kink acted as a barrier trapping hot air to the south and cold air to the north. The consequence of this static mass of hot air was the heatwave that devastated Russia. With the jet stream stalled the STJ was unable to transit across the Himalayas as it would do ordinarily, the monsoon cell to the south, fed by warmer waters in the Indian Ocean, had nowhere to go and as a consequence it deposited vast amounts of rain over Pakistan, Himalchal Pradesh amd Jammu and Kashmir and this led to extensive flooding. |
The Somali Jet
The monsoon wind that is deflected to the north as it crosses the equator is further deflected to the east by the mountains of Africa. The progress of the southwest monsoon towards India is greatly aided by the onset of certain jet streams including the crucial Somali jet that transits Kenya, Somalia and Sahel and exits the African coast at 9 degrees north at low level and very fast. J. Findlater, a British meteorologist observed this low level jet stream was found to be most pronounced between 1.0 and 1.5 km above the ground. It was observed to flow from Mauritius and the northern part of the island of Madagascar before reaching the coast of Kenya at about 3º S. Subsequently it ran over the plains of Kenya, Ethiopia and Somalia before reaching the coast again around 9º N. The jet stream appears to be fed by a stream of air, which moves northwards from the Mozambique Channel.
The major part of this low level jet penetrates into East Africa during May and, subsequently, traverses the northern parts of the Arabian Sea before reaching India in June. Observations suggest that the strongest cross equatorial flow from the southern to the northern hemisphere during the Asian Summer Monsoon is in the region of the low level jet. This has intrigued meteorologists, because it is not clear why the major flow of air from the southern to northern hemisphere should take place along a narrow preferred zone off the East African coast. The importance of the low level jet arises from the fact that its path around 9º N coincides with a zone of coastal upwelling. As the strong winds drive away the surface coastal waters towards the east, extremely cold water from the depths of the sea rise upwards to preserve the continuity of mass. This upwelling is brought about by strong low level winds. After the low level jet moves towards the Indian coastline around 9º N, it separates into two branches. One appears to move to the northern parts of the Indian Peninsula while the other recurves towards the southern half of the Indian coastline and Sri Lanka. It is still not clear why the jet separates into two branches. Findlater analysed the wind profile for the months of July and August and found a relationship between the cross-equatorial airflow, between 1.0 and 1.5 km, over Kenya and the rainfall over western India. He opined that an increase in the cross-equatorial flow was followed by an increase in rainfall over the west coast.
The Somali Current
Oceanographers have been interested in yet another phenomenon, which appears to have some relationship with the low level jet stream off the coast of eastern Africa. This ocean current named the Somali Current, flows northward from the equator to 9º N, where it separates from the coast. It is a fairly strong current with a velocity maximum of 2 m m/s, but speeds as large as 3 m m/s have also been observed. The Somali Current may be considered to be a western boundary current of the Indian Ocean. But, its peculiar feature is a reversal in direction with the onset of the summer monsoon. In winter, this current is from north to the south running southwards from the coast of Arabia to the east African coastline; but with the advent of the summer monsoon it reverses its direction and flows from the south to the north. This suggests a relationship with the reversal of monsoon winds, but usually the oceans respond very slowly to changes in atmospheric circulation and oceanographers have wondered why the Somali Current reverses its direction and reaches its maximum speed nearly a month earlier than the onset of southwesterly monsoon winds.
Sub-tropical Westerly and Tropical Jet Streams
Certain interesting changes take place in the upper atmosphere with the advent of the summer monsoon. Towards the end of May, a narrow stream of air, which moves from the west to the east over northern India, suddenly weakens and moves to a new location far to the north of the Himalayas. This is known as sub-tropical westerly jet stream. Its movement towards the north is one of the main features associated with the onset of the monsoon over India. As the westerly jet moves north, yet another jet stream sets in over the southern half of the Indian peninsula. This flows in the reverse direction from the east to west. It is called tropical easterly jet, and it exhibits periodic movements to the north and south of its mean location during the hundred-day monsoon season beginning with the first of June and ending around mid-September.
The altitude at which the winds attain their maximum strength in the tropical easterly jet is around 150 hPa, but the maximum winds associated with the sub-tropical westerly jet occur at a lower altitude of 300 hPa. A remarkable feature of the tropical easterly jet is that it can be traced in the upper troposphere right up to the west coast of Africa. HPa refers to 'hecta Pascal' and is a unit of measure of atmospheric air pressure
Subscribe to:
Posts (Atom)